Turning A Raspberry Pi 5 Into A Passive Network Monitor

EXPERIMENTAL!
Pretty sure the upload/download is murdering my connection. Just get a router that natively supports OpenWRT and you're good.
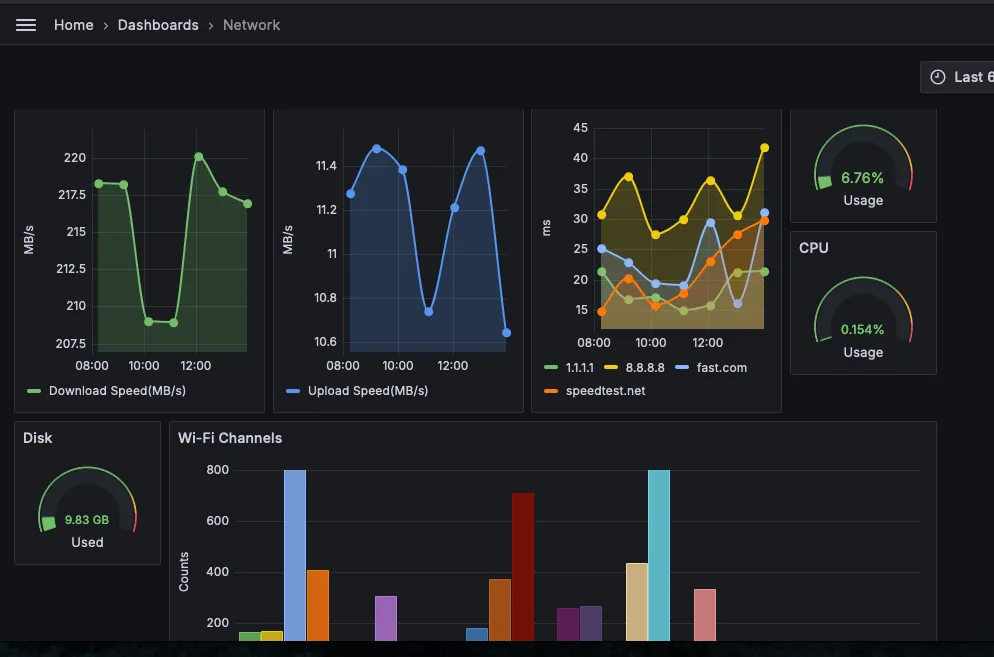
I'm going to walk you through the process I took to turn my Raspberry Pi 5 into a "passive" network statistics hub, leveraging a TIG stack. Got it? cool. What this will monitor is available network bandwidth, the Pi's hardware usage, and wifi channel usage in the wireless range of the Pi. This is going to be somewhat comprehensive, but then also somewhat just get it working. I'm not concerned or focusing on security here. I tried to go through my bash history but there is a lot of garbage in there. Think I had initially set it to 1000 lines, and it was all ate up.
*Prerequisite, get a Pi 5.*
1. Install your TIG stack
For this were going to use docker-compose for orchestration. Use whatever flavor you want. I have used Podman before so I went with docker-compose for this to try something new. Get your packing up-to-date:
sudo apt update && sudo apt upgrade -y
Install Docker and set up the "working" directory.
sudo apt install -y docker.io docker-compose
sudo systemctl enable docker
sudo systemctl start docker
mkdir ~/network_monitor
cd ~/network_monitor
Create a docker-compose.yaml file cause you feel fancy saying yaml
services:
  influxdb:
    image: influxdb:latest
    container_name: influxdb
    restart: always
    ports:
      - "8086:8086"
    volumes:
      - ./influxdb:/var/lib/influxdb2
      - /etc/localtime:/etc/localtime:ro
      - <I also like to add a mount for .bash_history so its persistent, and cross container ex. ~/.bash_history:/<home for your container user>/.bash_history>
    environment:
      - INFLUXDB_DB=network_monitor
      - INFLUXDB_ADMIN_USER=<admin user>
      - INFLUXDB_ADMIN_PASSWORD=<admin user password>
      - INFLUXDB_USER=<telegraf user>
      - INFLUXDB_USER_PASSWORD=<telegraf user password>

  grafana:
    image: grafana/grafana:latest
    container_name: grafana
    restart: always
    ports:
      - "3000:3000"
    volumes:
      - ./grafana:/var/lib/grafana
      - /etc/localtime:/etc/localtime:ro
      - <also .bash_history mount>
    environment:
      - GF_SECURITY_ADMIN_USER=<admin user>
      - GF_SECURITY_ADMIN_PASSWORD=<admin user password>

  telegraf:
    build:
      context: ./telegraf_build
      dockerfile: Dockerfile
    network_mode: "host"
    container_name: telegraf
    dns:
      - 8.8.8.8
      - 8.8.4.4
    restart: always
    volumes:
      - ./telegraf/telegraf.conf:/etc/telegraf/telegraf.conf:ro
      - /your/path/network_monitor/wifi_channels.log:/how/you/want/to/mount/network_monitor/wifi_channels.log:ro
      # thats out output file we will read wifi channel usage from
      - /proc:/host/proc:ro
      - ./telegraf:/etc/telegraf
      - /var/run/docker.sock:/var/run/docker.sock
      # think i added this to give me access to some of the host ports/hardware
      - /etc/localtime:/etc/localtime:ro
      - <also .bash_history mount>
    depends_on:
      - influxdb
    environment:
      - HOST_PROC=/host/proc
Those are the default ports. Use what you want. Now get em running.
docker-compose up -d
2. Configure Telegraf
Telegraf has a lot of "plugins". You can find their online source here Github. The few I am going to use are the "inputs" to feed InfluxDB and of course an "output" to InfluxDB.
[agent]
  interval = "30s"
  round_interval = true
  metric_batch_size = 1000
  metric_buffer_limit = 10000
  collection_jitter = "0s"
  flush_interval = "10s"
  flush_jitter = "0s"

[[outputs.influxdb_v2]]
  urls = ["http://localhost:8086"]
  token = "<InfluxDB token"
  bucket = "network_monitor"
  organization = "yes"

[[inputs.internet_speed]]
  # this saved me a lot of heartache. I offset the interval so when everyone else's on the whole internet went off on the hour, mine was a few minutes early.
  interval = "57m"
  memory_saving_mode = true
  name_suffix = "_speedtest"

[[inputs.ping]]
  interval = "57m"
  urls = ["fast.com", "8.8.8.8", "speedtest.net", "1.1.1.1"]
  count = 5
  ping_interval = 1.0
  timeout = 5.0
  name_suffix = "_speedtest"

[[inputs.tail]]
  files = ["/<that path you made earlier>/network_monitor/wifi_channels.log"]
  data_format = "influx"
  from_beginning = true

[[inputs.net]]
  interfaces = ["eth0", "wlan0"]
  ignore_protocol_stats = true

[[inputs.cpu]]
  percpu = false
  totalcpu = true
  fieldexclude = ["time_*"]
  # time is fake
  interval = "6m"
  # 6 minutes cause it gives us some nice staggered and equal data points on an hour scale

[[inputs.mem]]
  interval = "6m"

[[inputs.disk]]
  ## By default, telegraf gathers stats for all mount points.
  ## To restrict to specific mount points, list them here:
  # mount_points = ["/", "/mnt/data"]

  ## Ignore certain mount points based on a pattern. Or don't.
  ignore_fs = ["tmpfs", "devtmpfs", "overlay"]
  interval = "24h"
3. Wifi Channel Scanning Cronjob Setup
Create yourself a bash script you dirty script kiddy. Don't forget to +x chmod it and insert:
#!/bin/bash
sudo iw dev wlan0 scan | grep primary\ channel: | awk '{print $4}' | sort | uniq -c | awk '{print "wifi_channels,channel="$2" count="$1}' > /<volume mounted directory before>/network_monitor/wifi_channels.log
This is going to use the wlan0 interface so don't be like me and turn it off for days on end if you plug in the eth0.
4. Configure Grafana Dashboard
Now you visualize it all. I could export the json of my dashboard, but I have already done enough. I'm using the InfluxQL flavor in my Grafana, an example query for a download speeds panel using a time series graph like above would be:
SELECT mean("download") FROM "internet_speed_speedtest" WHERE $timeFilter GROUP BY time($__interval)
What's Next? Besides Hardening
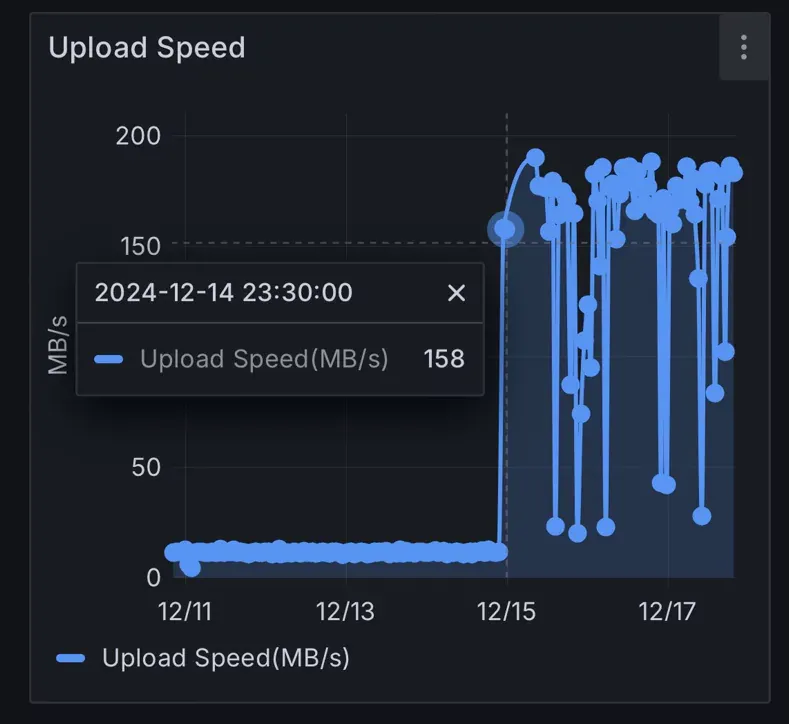
I actually got a pretty quick return on investment. Last night we were having connection issues. Did a speed test and it was terrible. Grabbed my laptop to start digging into it and then my laptop's speed test was just fine, except I noticed my upload speed had 30x itself. I was like, hold up, lets check the books. logged into Grafana and ~dec. 14th around 11pm, I noticed was when my upload speed had be "upgraded'. Apparently my ISP decided to give everyone "symmetrical speeds" and never told anyone. Thanks Spectrum. Let me know if this qualifies as sponsor worthy.
Pretty certain the upload/download murders my connection since that input uses an actual file. Ookla and speedtest-cli are other options but they had wilder swings in the metrics gathered.

The misses thoughtfully purchased me an m.2 pi hat and micro nvme drive. I have that installed and since this TIG stack has such a small footprint on the hardware resources, I intend to throw Retropie on there along side it.

